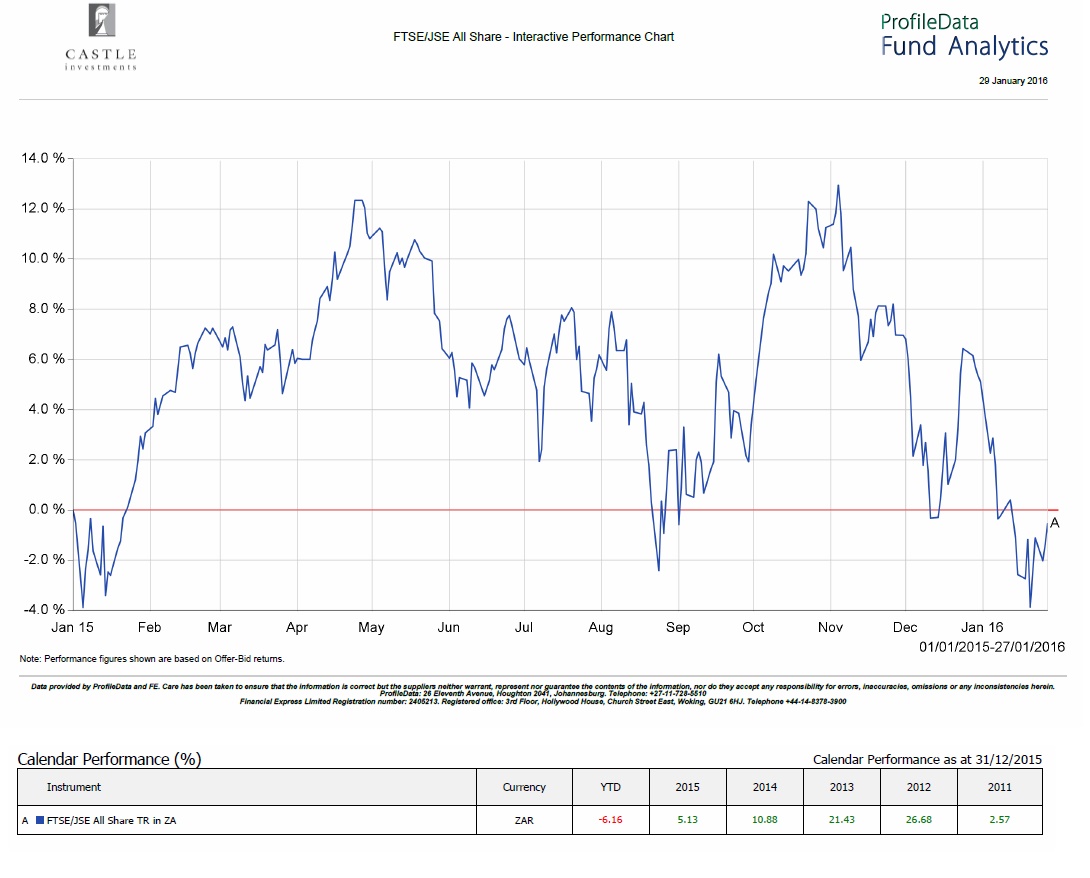
FTSE/JSE All Share Performance Chart
What goes down must go up….and down and up again. Much has been said about the volatility on world markets, and the accompanying graph shows the JSE is no exception. Over the past year the bulls and the bears battled it out on an almost monthly basis as the bourse was buffeted by both domestic and international factors. The good news is that, as shown by the performance table charting the last five years, medium to long term investors have scored handsomely. From the high of a return of 26.68 in 2012, to the low of a return of 5.13 last year, the JSE continues to show that shares must be part of your investment portfolio.

